This study found that:
- Activity in the striatum of people who smoke changed less in response to positive feedback/reward than in nonsmokers; this effect was more pronounced with greater addiction severity.
- Activity of a brain region called the habenula was linked to nicotine withdrawal/craving and was reduced by nicotine administration in people who smoke.
- Current smoking cessation treatments affect the activity of the habenula but not the striatum.
Despite smoking’s well-known devastating effects on health, quitting is difficult for most people who smoke, primarily because of nicotine’s highly addictive properties. A recent NIDA-sponsored study showed that two separate brain processes are linked to nicotine addiction severity and nicotine withdrawal, respectively, which may account for some of the difficulties in stopping smoking. The findings may help researchers devise new ways to help more people quit smoking.
Ms. Jessica Flannery and colleagues at Florida International University and at NIDA are analyzing brain activity differences between people who smoke cigarettes and nonsmokers. In this study, the team investigated whether brain activity was changed by two common medications used to help people quit smoking (i.e., nicotine patch and varenicline) and how these changes differed between people who smoke and nonsmokers. “Understanding changes in brain activity between smokers and nonsmokers and after getting medications is important to improve smoking treatments,” explains Dr. Matthew Sutherland, one of the study’s senior investigators.
The investigators focused on the activity of two brain areas implicated in addiction—the striatum and the habenula. The striatum is a key component of the brain circuits promoting addiction (i.e., reward processes). The habenula may contribute to negative reinforcement mechanisms that perpetuate nicotine use. It is activated by negative outcomes and the lack of rewards, and it acts like a “brake” on the reward processing system.
The investigators collected functional magnetic resonance imaging (fMRI), behavioral performance, and self-report data from 24 cigarette smokers who had been abstinent overnight and 20 nonsmokers. Each participant underwent six fMRIs: two each (with or without nicotine patch) at baseline, towards the end of 17 days of varenicline treatment, and towards the end of 17 days of placebo treatment. This experimental design allowed the researchers to compare stable brain alterations among people who smoke with more transient brain fluctuations following medication administration. In addition, the researchers assessed the participants’ performance on tests designed to measure striatal and habenular activity by providing positive and negative performance feedback. Positive feedback is known to activate the striatum, whereas negative feedback activates the habenula.
Different Aspects of Nicotine Use Were Linked With Different Brain Areas
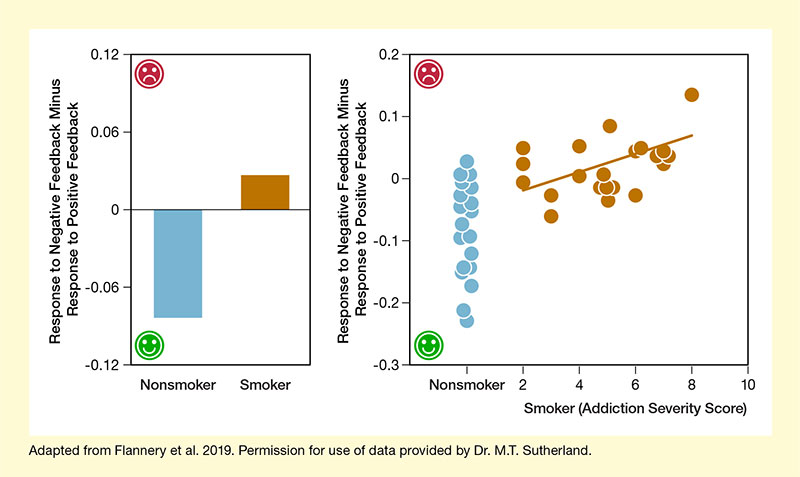
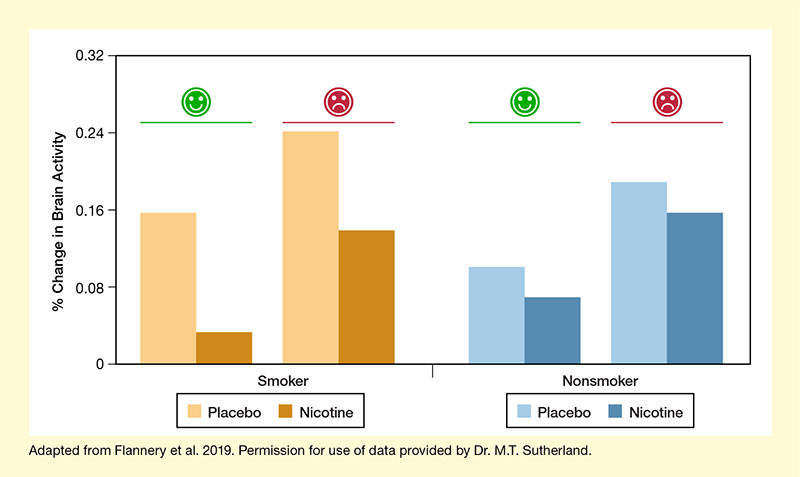
The study produced two key findings. First, compared with nonsmokers, people who smoke showed less activity in the striatum in response to positive feedback (i.e., reward) (see Figure 1). This effect was more pronounced with greater addiction severity and was not alleviated by nicotine or varenicline treatment. Second, nicotine treatment reduced the habenula’s activity in response to both positive and negative feedback among overnight abstinent smokers, but not among nonsmokers (see Figure 2). Also, greater habenular activity was associated with higher craving among the people who smoke.
The findings demonstrate that different aspects of nicotine use, such as addiction severity and nicotine withdrawal, are linked with different brain processes. “Specifically, brain processes associated with how strongly addicted a person reported being to smoking were related to alterations in the striatum. On the other hand, how much a smoker was craving a cigarette was related to activity alterations in the habenula,” says Dr. Sutherland. Current treatments such as nicotine replacement therapy only appear to affect the brain activity linked to nicotine withdrawal and craving but do not affect striatal activity. Accordingly, interventions simultaneously targeting both addiction-related and withdrawal-related aspects of nicotine use may improve currently poor cessation outcomes.
This study was supported by NIDA grants DA037819 and DA041353 and NIDA’s Intramural Research Program.
- Text Description of Figure 1
-
The figure compares the response to positive and negative feedback in people who smoke and nonsmokers based on brain activity in the left striatum. For both panels, red symbols in the upper left corner represent negative feedback and green symbols in the lower left corner represent positive feedback. In both panels, the vertical y-axis indicates the response to negative feedback minus the response to positive feedback, with negative values denoting greater responsivity to positive feedback and positive values denoting greater responsivity to negative feedback.
In the left panel, the blue bar on the left represents nonsmokers and is at approximately -0.09; the brown bar on the right represents people who smoke and is at approximately +0.03.
In the right panel, the horizontal x-axis indicates the addiction severity score of individual participants. Blue dots on the left represent individual nonsmokers. Their response scores are spread out between approximately -0.24 and +0.04. Brown dots on the right represent individuals who smoke and are rated on an addiction severity score from 2 to 10. For participants with an addiction severity score of 2, the response scores range from -0.02 to +0.6; for those with an addiction severity score of 3, the response scores range from -0.08 to -0.04; for those with an addiction severity score of 4, the response scores range from -0.02 to +0.06; for those with an addiction severity score of 5, the response scores range from -0.05 to +0.08; for those with an addiction severity score of 6, the response scores range from -0.05 to +0.05; for those with an addiction severity score of 7, the response scores range from +0.01 to +0.05; and for the person with an addiction severity score of 8, the response score was about 0.14. A brown line indicates mean values and goes from a response score of about -0.02 at an addiction severity score of 2 to a response score of about +0.06 at an addiction severity score of 8.
- Text Description of Figure 2
-
The bar chart illustrates the effects of placebo and nicotine on brain activity in the habenula in response to positive and negative feedback of people who smoke (brown bars on the left) and nonsmokers (blue bars on the right). Light brown and light blue bars indicate response to placebo and dark brown and dark blue bars indicate response to nicotine. Green symbols above the first and third set of bars indicate response to positive feedback, and red symbols above the second and fourth set of bars indicate response to negative feedback. The vertical y-axis shows the change in brain activity in the habenula on a scale from 0 percent to 0.32 percent. From left to right, the change in brain activity was as follows: for people who smoke who responded to positive feedback, increased about 0.16 percent in those treated with placebo and about 0.03 percent in those treated with nicotine; for people who smoke who responded to positive negative feedback, brain activity increased about 0.24 percent in those treated with placebo and about 0.15 percent in those treated with nicotine; in nonsmokers who responded to positive feedback, brain activity increased about 0.11 percent in those treated with placebo and about 0.08 percent in those treated with nicotine; and in nonsmokers who responded to negative feedback, brain activity increased about 0.19 percent in those treated with placebo and about 0.16 percent in those treated with nicotine.
Source:
- Flannery, J.S., Riedel, M.C., Poudel, R., et al. Habenular and striatal activity during performance feedback are differentially linked with state-like and trait-like aspects of tobacco use disorder. Science Advances. 5(10):eaax2084, 2019.