This study found that:

- When an antiviral response was triggered in immune cells obtained from people with opioid use disorder (OUD), the expression of genes mediating this response was suppressed compared with cells from people without OUD.
- Acute morphine exposure suppressed antiviral gene expression following stimulation of the antiviral response in immune cells from healthy individuals.
Opioid drugs affect not only the brain and, consequently, behavior, but also numerous other body systems whose cells carry opioid receptors, including the peripheral immune system. However, studies examining opioids’ effects on the peripheral immune system have yielded mixed results. While some studies have suggested that opioids can suppress the immune system, others have found that these drugs can activate immune responses. Some of these discrepancies are likely attributable to differences in study design and to the specific immune cell types and genes examined.
A NIDA-sponsored study demonstrated that both acute and chronic opioid exposure can interfere with the immune response to viral infections. The findings may help explain why people who use opioids may be more susceptible to such infections.
Antiviral Response Genes Are Suppressed in Cells from People With OUD
Dr. Christine Cheng and her graduate students Tanya T. Karagiannis and John P. Cleary, Jr., from Boston University and colleagues from other institutions assessed the effects of chronic opioid exposure on antiviral immune responses in blood cells (peripheral blood monocytes, or PBMCs) taken from people with and without OUD. They also analyzed the effects of acute opioid exposure by briefly treating PBMCs of healthy people with morphine. Because PBMCs are a mixture of different immune cell types that may respond differently to opioid exposure and immune stimuli, the team used a technique called single-cell RNA sequencing to detect changes in gene expression of individual cells, allowing them to distinguish between specific cell types.

The researchers isolated PBMCs from people with or without OUD and exposed them to lipopolysaccharide (LPS)—a bacterial compound that can trigger an immune response. They then compared the expression of several antiviral genes in four different types of immune cells in the PBMC samples. The analyses found that in all subtypes of immune cells from people with OUD, antiviral gene expression was significantly suppressed compared with the control samples from people without OUD (Figure 1). In contrast, genes involved in other parts of the immune response were only modestly affected in people with OUD.
Acute Opioid Exposure Modestly Suppresses Antiviral Genes
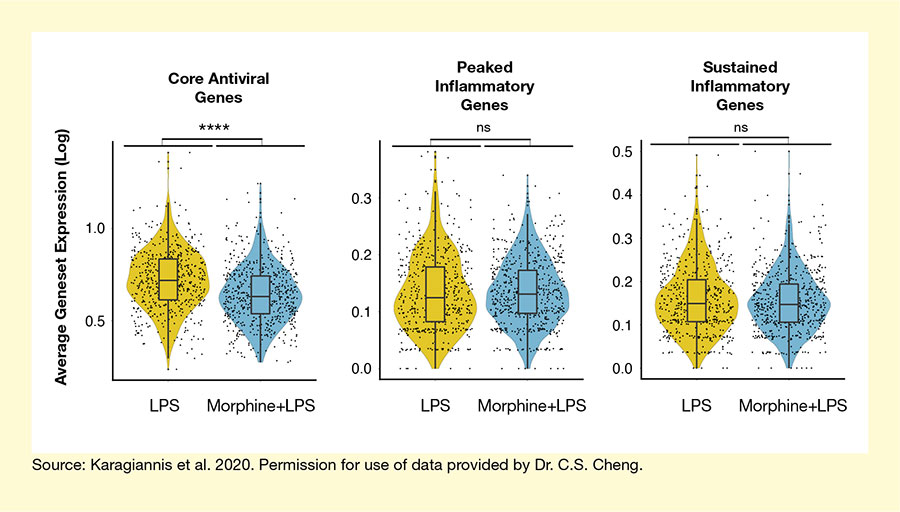
The investigators also assessed the effects of acute morphine exposure on PBMCs from healthy people that were treated with LPS to trigger an immune response. Following LPS treatment, cells that had been exposed to morphine showed a modest but consistent downregulation of antiviral response-associated gene expression compared with cells not exposed to morphine (Figure 2). As with the effects of chronic opioid exposure, this downregulation was more pronounced for antiviral response genes than for other immune genes.
Thus, both chronic and acute exposure to opioids can interfere with the responses of various cells of the peripheral immune system, specifically suppressing the expression of genes that are crucial for the antiviral immune response. This may explain, at least in part, why people with OUD are more susceptible to opportunistic infections. The findings are also clinically relevant because many people treated with opioid pain medications, such as patients who had surgery or cancer patients undergoing chemotherapy, are already at increased risk of infection, and opioid-induced suppression of antiviral genes may exacerbate this susceptibility.
Finally, in the context of the COVID-19 pandemic and the increased susceptibility of people with recent OUD diagnosis to COVID-19, the findings raise the question whether opioid-related impairment of antiviral responses might contribute to this enhanced susceptibility.
This work was supported by NIDA grants DA047032, DA17305, DA042620, DA046436, and DA041883.
- Text Description of Figure 1
-
The figure shows the average geneset expression of three groups of immune response genes, including core antiviral genes (left), peaked inflammatory genes (middle), and sustained inflammatory genes (right) in CD4+ cells after treatment with LPS. The horizontal x-axis shows the samples analyzed. For each group of genes, there were samples from three control subjects (C1, C2, and C3) on the left and three opioid-dependent subjects (O1, O2, and O3) on the right. The vertical y-axis shows average expression of all genes indicated as log expression on a scale from 0 to 1.0 for the core antiviral genes, a scale from 0 to 0.4 for the peaked inflammatory genes, and a scale from 0 to 0.6 for the sustained inflammatory genes. Black dots indicate individual cells analyzed. Small yellow boxes in the control samples and small blue boxes in the opioid-dependent samples indicate the 25th percentile (bottom edge), median (line in the middle), and 75th percentile (top edge) of gene expression for each sample. Horizontal black lines with four asterisks above the three panels indicate that the differences between control samples and opioid-dependent samples were statistically significant.
- Text Description of Figure 2
-
The figure shows the effect of morphine treatment on expression of genes involved in antiviral immune responses in CD4+ T-cells that had been treated with LPS. Gene expression was analyzed for core antiviral genes (left), peaked inflammatory genes (middle), and sustained inflammatory genes (right). For each panel, LPS-treated cells are shown on the left and LPS-plus-morphine–treated cells on the right. The vertical y-axis shows average geneset expression indicated as log expression on a scale from 0 to 1.0 for the core antiviral genes, a scale from 0 to 0.3 for the peaked inflammatory genes, and a scale from 0 to 0.5 for the sustained inflammatory genes. Black dots indicate individual cells analyzed. Yellow shapes in the panels for LPS-treated cells and blue shapes in the panels for LPS-plus-morphine–treated cells indicate the main distribution of geneset expression. Small yellow boxes in the LPS-treated samples and small blue boxes in the LPS-plus-morphine–treated samples indicate the 25th percentile (bottom edge), median (line in the middle), and 75th percentile (top edge) of gene expression for each sample. The difference between LPS- and LPS-plus-morphine–treated samples was significant for the core antiviral genes, as indicated by the horizontal black line with four asterisks above it, but was not significant for the peaked and sustained inflammatory genes.
Source:
- Karagiannis, T.T., Cleary, J.P., Jr, Gok, B., et al. Single cell transcriptomics reveals opioid usage evokes widespread suppression of antiviral gene program. Nature Communications 11:2611, 2020. https://doi.org/10.1038/s41467-020-16159-y