These studies found that:

- Children with greater access to resources, better social support, and better perinatal health had larger brain surface areas and higher cognitive scores, regardless of family income.
- Neighborhood poverty was independently associated with hippocampal and prefrontal brain volume as well as performance on cognitive tasks.
A host of studies are investigating the relationships between socioeconomic status (SES), cognitive performance, and brain development in children and adolescents. Past studies suggested that children growing up in families with low SES were at increased risk of exhibiting worse cognitive performance, developing mental and physical health problems in adulthood, and showing altered development of certain brain structures. Recently, two studies drawing on data from the Adolescent Brain Cognitive Development (ABCD) Study® indicated that the relationships between SES and these outcomes are not straightforward and that numerous other related factors also influence risk and resilience during children’s development.
Dr. Marybel R. Gonzalez from the Children’s Hospital Los Angeles and colleagues from other institutions determined that factors like access to resources or perceived social support, and not poverty itself, influence resilience and/or risk for better or poorer outcomes. Additionally, Ms. Rita L. Taylor and colleagues at Washington University in St. Louis showed that not only individual household poverty level but also broader neighborhood poverty affected individual outcomes.
The ABCD Study
The ABCD Study is the largest long-term study of brain development and child health in the United States. It includes more than 11,000 children from across the United States who were recruited when they were 9 to 10 years old and will be followed through adolescence. The researchers are conducting brain scans of all participating children every other year to study brain development (e.g., total surface area of the brain as well as the sizes of individual brain regions). They also regularly take blood samples as well as conduct comprehensive physical, cognitive, social, emotional, behavioral, environmental, and academic assessments of the children and their families once or twice per year. The study aims to gain a deeper insight into normal brain development and outcomes as well as on the effects of individual, familial, or environmental influences, including drug exposure.
The data are being shared regularly with the research community to allow for a wide range of analyses using one standardized data set. The results of the studies will provide families, educational systems, health professionals, and policymakers with practical information to promote the health, well-being, and success of children.
Numerous Factors Moderate the Influence of SES on Brain Structure and Cognitive Functioning
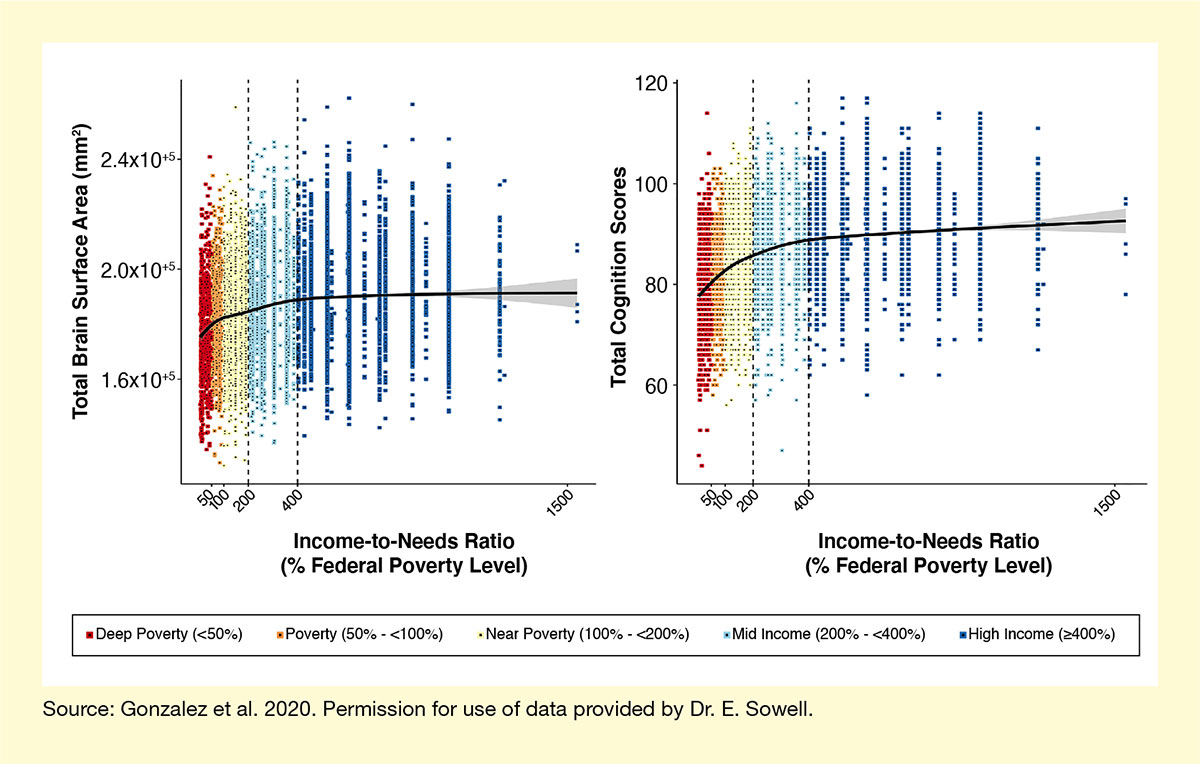
Dr. Gonzalez and her colleagues focused on factors that impart risk or resilience in the context of adversity in the environment, such as low SES (e.g., household income and other household financial variables) or neighborhood disadvantage. The team demonstrated that both total surface area of the brain and the children’s cognitive scores decreased with family SES (see Figure). These effects were particularly pronounced in children whose families had an SES below 200 percent of the federal poverty level (i.e., living in deep poverty, poverty, or near poverty). But even children from families with an SES between 200 percent and 400 percent of federal poverty level (which was considered mid-income) were more affected by changes in SES than were children whose families had an SES above 400 percent of the federal poverty level (high income).
However, both brain surface area and cognitive scores also were affected by factors other than SES. For example, youth who had greater access to resources relative to lower levels of economic, psychosocial, and physiological adversity; who felt that they received more social support; or who had experienced better perinatal health had better brain and cognitive outcomes, regardless of family income. Dr. Gonzalez concludes, “The present report extends our previous body of work by elucidating potentially remediable factors in the environment that could improve health outcomes for children.”
Neighborhood Poverty Influences Brain Development and Cognitive Outcomes
Ms. Taylor and her colleagues examined the relationship between SES and brain development from a broader perspective. Rather than assessing the influence of individual household poverty, they investigated the impact of neighborhood poverty on children’s outcomes. The team focused on cognitive function as well as on the development of the prefrontal cortex, which plays a central role in executive functions (e.g., attention, impulse control), and the hippocampus, which is essential for memory. The researchers analyzed data on each participant’s SES as well as on neighborhood poverty as reflected by factors such as the percentage of families living in poverty, unemployment rate, and aggregate level of educational attainment. They then related these measures to cognitive scores and prefrontal and hippocampal volumes.
The analyses revealed complex relationship patterns between household incomes, neighborhood poverty levels, cognitive scores, and brain structure volumes. Overall, the data indicated that children living in neighborhoods with high poverty levels had lower cognitive scores and brain structure volumes, independent of the income level of the individual household. “The results indicated that neighborhood poverty is useful to include in models examining poverty’s impacts in the current sample,” says Ms. Taylor. She adds, “This suggests that different conceptualizations of poverty could be used to more comprehensively determine the total impact of poverty on the individual.”
This work was supported by NIDA grants DA041022, DA041028, DA041048, DA041089, DA041106, DA041117, DA041120, DA041134, DA041148, DA041156, DA041174, DA041123, DA041147, DA041093, DA041025, DA041048, and DA051038.
- Text Description of Figure
-
The figure shows the nonlinear relationship between SES and brain surface area (left panel) and cognitive function (right panel). For both panels, the horizontal x-axis indicates the SES as represented by income-to-needs ratio, which is expressed as a percentage of federal poverty level on an exponential scale from 0 to 1,500%. In the left panel, the vertical y-axis shows the total brain surface area from 1.2x105 mm3 to 2.6x105 mm3. In the right panel, the vertical y-axis indicates cognitive functioning as indicated by total cognition score on a scale from 40 to 120. Individual data points are represented by colored dots, with red dots indicating individuals living in deep poverty, or less than 50% of federal poverty level; orange dots indicating poverty, or 50% to less than 100% of federal poverty level; yellow dots indicating near poverty, or 100% to less than 200% of federal poverty level; light blue dots indicating a mid income, or 200% to less than 400% of federal poverty level; and dark blue dots indicating a high income, or 400% or more of federal poverty level. The black line indicates the best fit for the association curve, with shaded gray areas indicating uncertainty of the best fit.
Sources:
- Gonzalez, M.R., Palmer, C.E., Uban, K.A., et al. Positive Economic, Psychosocial, and Physiological Ecologies Predict Brain Structure and Cognitive Performance in 9–10-Year-Old Children. Frontiers in Human Neuroscience 14:578822,2020.
- Taylor, R.L., Cooper, S.R., Jackson, J.J., Barch, D.M. Assessment of neighborhood poverty, cognitive function, and prefrontal and hippocampal volumes. JAMA Network Open 3(11):e2023774, 2020.